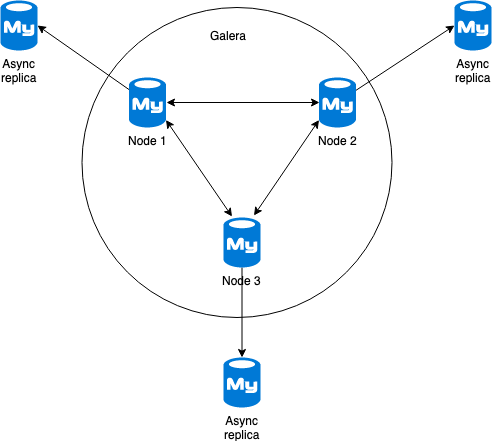
I mentioned in my Galera crash (un)safe post that it’s bad if a SST is triggered on a large dataset. On a Galera node an SST will simply wipe the contents of the MySQL data directory and copy a snapshot from another node in the cluster. For consistency this is a favorable thing to do, but from an HA perspective it isn’t: one node in the cluster is unavailable and another one is acting as donor. This means, if you have a three node Galera cluster, only two are available where one has “degraded” performance.
This could have quite high impact, for instance in the proxysql_galera_checker script only synced nodes are selected to receive traffic. By default the donor nodes will not receive any traffic and now the cluster only has one node left to serve traffic. Don’t worry: if there are no synced nodes available the donor node will still be selected as available, so in the case you only have one node left (bootstrapping) it can still serve traffic. This, obviously, isn’t a favorable situation you want to be in.
Partial failure on Galera
Now imagine we have a multi DC Galera cluster, as pictured below:
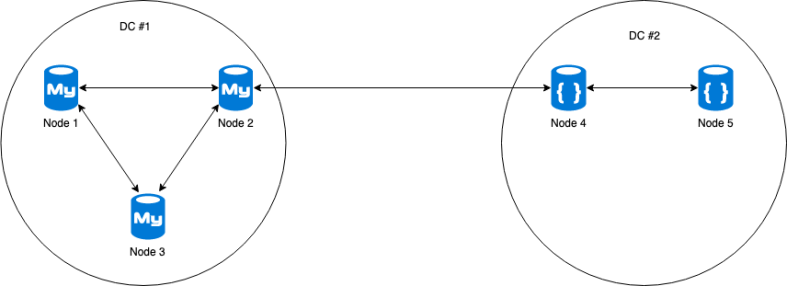
A power failure happens in DC #1 and nodes 1 to 3 are all gone. As the nodes in DC #2 are not a majority anymore, the nodes shut down out of safety. As I wrote before in the Galera crash (un)safe blog post: a crash unsafe Galera cluster will force SST to happen on crashed nodes and this happened as well in our case of the nodes in DC #1. The most favorable node to recover from is a cleanly shut down node in DC #2.
The bootstrap cluster automation performing the recovery of the cluster ran in sequential order through its configured hosts. Unfortunately the first node in the list was an unclean node in DC #1, forcing SST to happen on this host. If the other host in DC #2 would have been chosen, a simple IST would have sufficed and the second node in the cluster would have been brought up within minutes. Now the automation was waiting for the SST on the node in DC #1 and this caused a delay of 4 hours for the next node in the automation to be brought up.
Painful GCache durability
Durability of the GCache on a Galera node is calculated by looking up the first and last item in the ringbuffer and then calculate the time between the two. A Galera incremental state transfer (IST) can only happen if the delta of the writeset requested by the joining node is present in the GCache on the donor node. This durability is basically the time you are allowed to perform an IST from this node and this metric is one of the ones to keep an eye upon. Our GCache durability was somewhere in the range of 45 minutes.
When binary logging is set to row based replication and binlog_row_image is set to full (default), the data written to the binlog will contain the previous row state and the updated values. The same applies to the GCache ringbuffer: when set to full the entire previous state of the row will be written to the GCache.
On this particular cluster one of the tables looked similar to this:
CREATE TABLE product (
  pid BIGINT NOT NULL AUTO INCREMENT,
  title varchar(255) NOT NULL,
  description TEXT NOT NULL,
  specifications TEXT NOT NULL,
  stock INT NOT NULL DEFAULT 0,
  price INT NOT NULL DEFAULT 0,
  image_1 VARCHAR(255) NOT NULL,
  image_2 VARCHAR(255) NOT NULL,
  image_3 VARCHAR(255) NOT NULL,
  thumbnail_1 VARCHAR(255) NOT NULL,
  thumbnail_2 VARCHAR(255) NOT NULL,
  thumbnail_3 VARCHAR(255) NOT NULL,
  ...
  another 50+ columns
  ...
PRIMARY KEY(pid)) ENGINE=InnoDB;
You might think a SST isn’t a big deal, but if you have a data size of 1TB it will take about 3 hours to transfer on a 1Gb network or, if you’re lucky, 21 minutes on a 10Gb network. The connection between DC #1 and #2 was a VPN that was limited in bandwidth (about 400Mbps) and moving the 400GB snapshot between node 4 and node 1 took about 4 hours to complete.
As the bootstrapped node was online according to the ProxySQL script, it now allowed writes to the cluster while being a donor node. The mass-update jobs (stock and pricing sync) started to run once again altering all sorts of data inside the cluster. This means a SST taking 4 hours to complete would make IST impossible between the cleanly shut down nodes in DC #2! As a result inside DC #2 the SST will also happen between nodes 4 and 5. Luckily the local network in DC #2 is a bit faster than the VPN but it was a totally unnecessary recovery.
Recovery improvements
If we look at the outage, the cluster was unavailable for a few minutes thanks to ProxySQL sending all traffic to a single node. But according to the definition of high availability, a single node is not HA. So if we take into account that we need at least two nodes to be available, the recovery happens only after the first SST has completed. This means our Mean Time To Recover Service (MTTRS) on Galera was at least 4 hours!
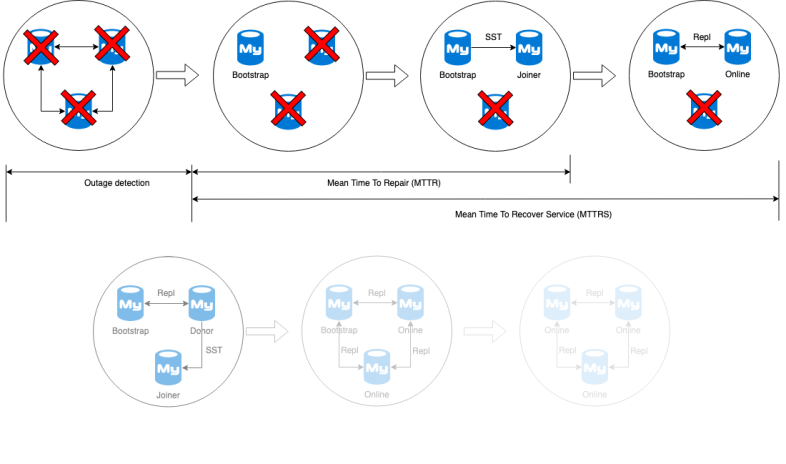
But as explained earlier: the ProxySQL script will not allow traffic to be sent to a donor, unless there is no other node available. This means right after node 1 has been recovered the ProxySQL script will remove the bootstrapped node 4 from available nodes and we’re back to one single node availability. Technically then the MTTRS should be extended till after node 2 has been recovered. But we’ll keep this discussion out of the scope for now.
In the post mortem of this incident we identified a couple of improvements we could make to speed up the recovery of a Galera cluster:
- Faster network (between DC #1 and DC #2)
- Make GCache bigger
- Increase GCache durability
- Make the transfer smaller
The first option was not feasible as it would increase cost dramatically, so we focused on option 2 and 3 at first. The GCache was already set to 4GB, which is already quite large. So we simply changed the binlog_row_image parameter from full to minimal. Since most modifications per row were only a few bytes this increased the durability from 45 minutes to somewhere between of 4 to 5 days! I felt a lot more confident that unnecessary SSTs wouldn’t happen anymore.
How to make a Galera State Snapshot Transfer smaller?
Now the fourth option proved to be a bit more challenging: how to decrease the data size of 400GB? We could just drop a couple of the tables larger than 50GB, but I think the product managers would be very angry at me. Another option would be to enable table compression, but I rather not go through the slow migration process on tables larger than 50GB with distributed storage on a hyperconverged infrastructure…
Another option is to compress during the creation of the xtrabackup snapshot and this is done for example by using the following configuration:
[sst]
compressor="gzip"
decompressor="gzip -dc"
This would save us probably something near half of the bytes to send over the line, and every byte compressed means we can send the SST faster, right? Naturally we wanted to test this and benchmark how much faster we would be able to move data between the two locations than our current uncompressed SST.
Benchmarking State Snapshot Transfers
We selected the following methods:
- Uncompressed
- Gzip
- Pigz (normal and fast)
- LZ4
- Snappy
- Qpress (LZH built in xtrabackup)
The method for testing was limit the bandwidth between two nodes in our Galera test cluster (4 cores and 8GB of memory) to 300Mbit, force SST to happen on one node and then measure the time between the SST to start and the moment when the node has rejoined the cluster. The amount of bytes transferred was measured through the network interface and we re-ran each method three times to get a reliable outcome.
First of all the throughput tells us already a couple of things:
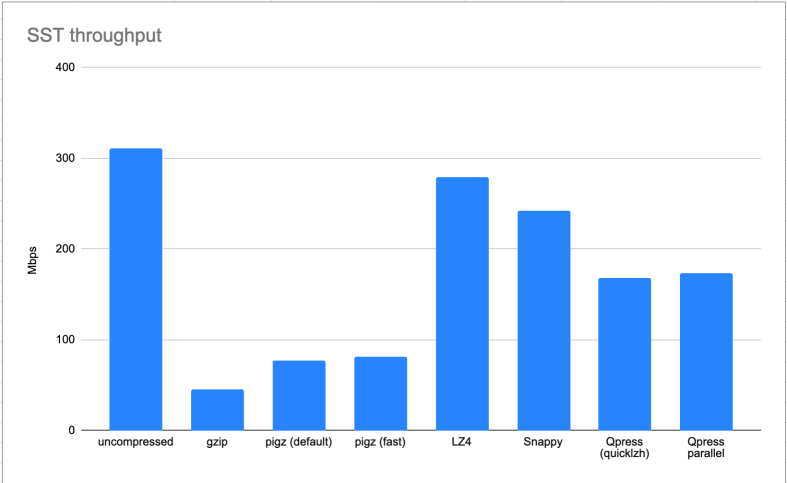
Galera SST benchmark network throughput
LZ4 and Snappy seem to be able to almost fully utilize the bandwidth of our test system, which is good.
We can see the throughput of gzip and pigz is very low. Gzip is renowned for being slow in the compression phase, but pigz (parallel gzip) is supposed to tackle this by allowing parallel execution of chunks of data. On the test machine the graphs of the gzip run were showing it actually was limited by the single core being utilized fully:
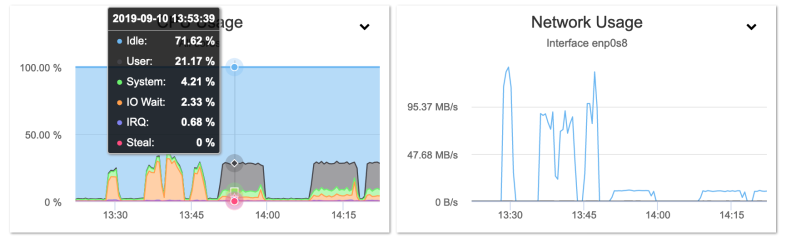
Benchmark SST donor GZIP (second set of peaks)
The peaks before the gzip runs are the uncompressed runs. Throughput really is dwarfed by the uncompressed run.
You may think pigz is any better, but alas even in fast compression mode it’s not much better:
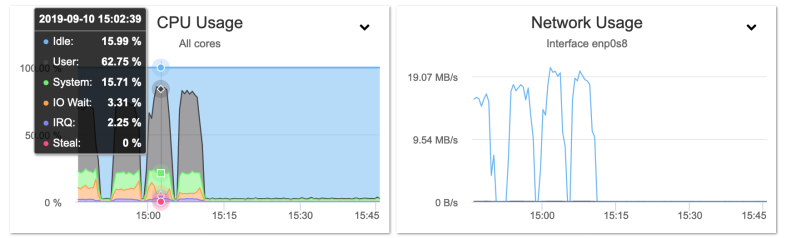
Benchmark SST donor PIGZ fast compression (last three peaks)
Yes it will compresses now on all four cores, but the throughput is only twice as much.
So what about the total amount of bytes transferred?
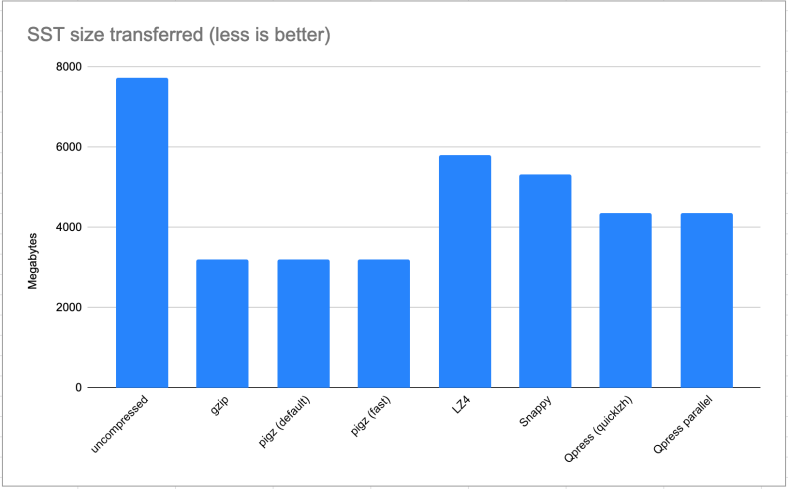
Galera SST benchmark – total bytes transferred
Gzip and pigz are truly king (and queen) here: they save almost 60% of total bytes transferred! This is an amazing achievement and it saves a lot of network bandwidth. LZ4 and Snappy do a much worse job at 25% and 32% respectively.
Now the most important graph, the total duration that we were after:
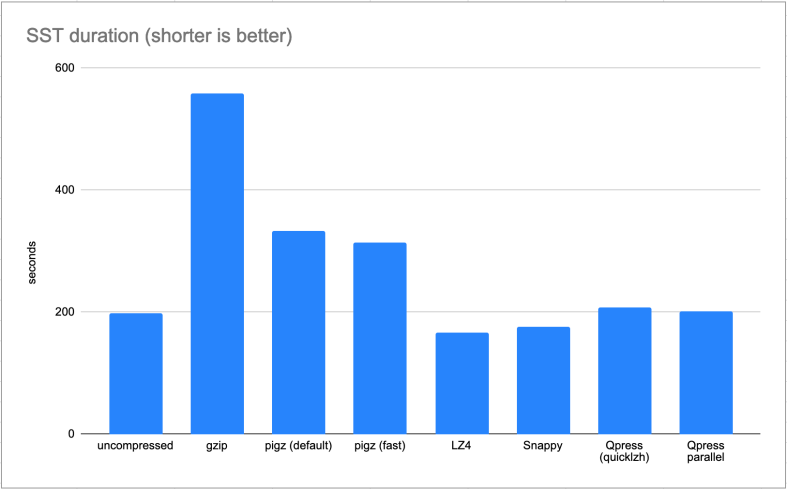
Galera SST benchmark – total duration
LZ4 and Snappy are clear winners here by saving us 15% and 11% in duration of the SST.
Conclusion
We applied Snappy to our production Galera cluster. As our production servers were slightly different we were able to save about 20% on the duration of the state snapshot transfer.
I think the outcome would also be a bit more favorable for pigz on these production servers as they ran on 8 cores instead of only 4 cores. However I fear for the responsiveness of a bootstrapped server utilizing all 8 cores to the maximum for a few hours. Snappy and LZ4 may compress a bit less, but they are much “friendlier” to your donor.
And the final advice I can give you is to keep an eye on the GCache durability as this may be a life saver one day!
Want more?
This is one of the background stories of my talk Benchmarking Should Never Be Optional on Wednesday 2nd of October 2019 at Percona Live Europe in Amsterdam.

In my talk I will feature a few cases why you should always benchmark your systems up front. It’s not only about database benchmarking, but in some cases even the entire system that requires benchmarking.